Worked examples / hypothetical math
Useful GPU-hour examples: why the cheapest GPU hourly rate can lose.
Direct answer: A cheap listed GPU rate can become expensive when retries, idle time, data staging, queueing, or low utilization reduce completed useful GPU-hours.
- These are hypothetical examples, not observed provider benchmarks.
- Use the formula to pressure-test real quotes, bills, and workload traces.
Formula
Useful GPU-hour cost
Useful GPU-hour cost is total GPU-related job cost divided by completed useful GPU-hours.
useful GPU-hour cost = total GPU-related job cost / completed useful GPU-hours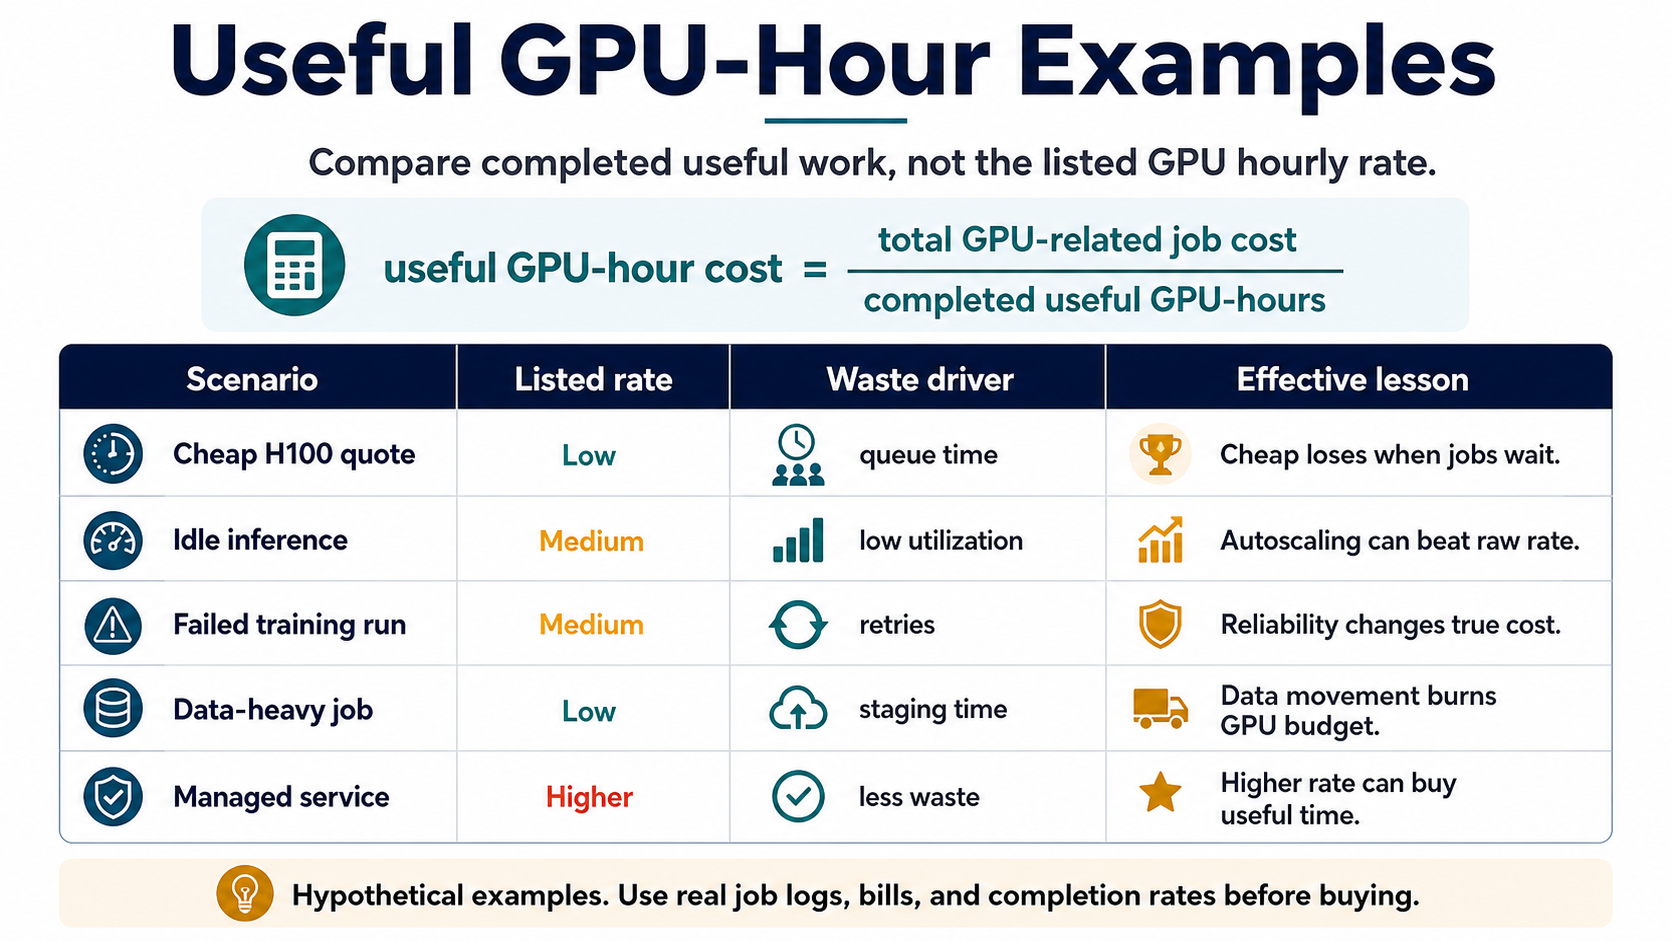
Copyable formula
Useful GPU-hour cost
Use this as the working formula in a spreadsheet, provider comparison doc, or finance note.
useful GPU-hour cost = total GPU-related job cost / completed useful GPU-hoursAdapt the math
Turn logs and invoices into a useful comparison
Do not force perfect accounting. The goal is to expose which quote assumption changes the winner.
How to adapt this to job logs
- Start with successful run time, failed run time, queue delay, and data staging duration.
- Separate completed useful work from provisioned or waiting time.
- Use the same denominator for every provider: completed useful GPU-hours.
How to adapt this to invoices
- Group GPU, storage, transfer, support, reservation, and marketplace costs before dividing.
- Include minimums and unused committed capacity when they are tied to the GPU job.
- Mark every missing line item before ranking providers.
Bad comparison vs good comparison
The bad comparison asks which provider has the lowest GPU hourly rate. The good comparison asks which option produces the lowest cost per completed useful GPU-hour.
| Comparison | What it includes | Why it can mislead or help |
|---|---|---|
| Bad comparison | Advertised H100 hourly rate only. | Ignores queueing, retries, idle capacity, data movement, support, and commitment terms. |
| Good comparison | Total GPU-related job cost divided by completed useful GPU-hours. | Compares the cost of completed work instead of the cost of renting hardware on paper. |
Hypothetical GPU quote evaluation
This example uses invented numbers to show the method. It is not a provider benchmark and should not be treated as current market pricing.
| Quote input | Lower listed rate option | Higher listed rate option |
|---|---|---|
| Listed GPU rate | $2.00/hr | $3.00/hr |
| Completed useful GPU-hours | 10 | 10 |
| Waste driver | 5 hours of queueing, retry, and data staging tied to the job | 1 hour of managed overhead and staging |
| Total GPU-related job cost | $30.00 | $33.00 |
| Useful GPU-hour cost | $3.00 per useful GPU-hour | $3.30 per useful GPU-hour |
| Decision lesson | Still cheaper, but much less than the listed rate suggests. | Higher listed rate nearly catches up because waste is lower. |
Procurement checklist
Sample provider questions
Send the same questions to every provider before comparing quotes.
Questions to ask
- What exact GPU model, memory size, GPU count, and node shape are included?
- Is capacity immediately available, queued, spot-like, reserved, or dedicated?
- What storage is persistent, what is ephemeral, and how are snapshots billed?
- What ingress, egress, private transfer, and cross-region charges can apply?
- What happens to cost when jobs fail, retry, queue, or sit idle?
- What support response, SLA, and incident path are included?
- What minimum rental window, deposit, reservation, or commitment changes the effective cost?
Quote red flags
- The quote shows GPU hourly rate but omits storage, network transfer, support, or minimum rental windows.
- The provider cannot explain queue behavior, retry impact, or capacity availability.
- The comparison treats managed and self-service GPU options as equal without pricing team time.
- The workload has heavy data staging but the quote only covers GPU runtime.
- The buying decision is based on a benchmark run that did not include failed jobs or idle production time.
Spreadsheet-style fields to capture
Use these fields before presenting a GPU quote comparison to finance, engineering leadership, or procurement.
| Field | Capture | Why it matters |
|---|---|---|
| listed_gpu_rate | Advertised GPU hourly rate | Use only as the starting point. |
| job_runtime_hours | Time the useful job actually ran | Separates completed work from provisioned time. |
| queue_or_wait_hours | Queueing, setup, and wait time | Exposes delay that can erase a lower rate. |
| failed_or_retry_hours | Failed, cancelled, or repeated run time | Reliability changes effective cost. |
| storage_and_transfer_cost | Persistent storage, staging, snapshots, ingress, and egress | GPU jobs often drag data costs with them. |
| support_and_commitment_cost | SLA, support tier, reservation, minimums, deposits | Contract terms can dominate comparison. |
| completed_useful_gpu_hours | Completed useful GPU-hours | This is the denominator in the comparison. |
Use this next
Turn the example into a real buying checklist
The flagship example page works best when paired with the framework, H100 quote checklist, GPU quote checklist, and topic hub.
Use this when you need the core definition and decision rule.
Decision pageH100 quote checklistProvider questionsUse this before committing to an H100 cloud quote.
ResourceGPU cloud quote checklistReusable worksheetUse this to compare storage, network, support, and commitment terms.
Topic hubGPU cloud pricingRelated pagesUse this to keep narrowing the GPU placement question.
Five hypothetical examples
These examples isolate common waste drivers. They are intentionally simple so the comparison can be checked against a real quote or workload trace.
| Scenario | Listed rate | Waste driver | Effective comparison | Lesson |
|---|---|---|---|---|
| Cheap GPU with failed training retry | $2.00/hr | A 10-hour run fails once at hour 8, then completes on retry. | Total GPU cost = $36 for 18 paid hours; completed useful work = 10 GPU-hours; useful GPU-hour cost = $3.60/hr. | The cheaper listed rate loses when reliability creates repeated paid time. |
| Higher rate with stable completion | $3.00/hr | The same 10-hour run completes once without retry. | Total GPU cost = $30 for 10 paid hours; completed useful work = 10 GPU-hours; useful GPU-hour cost = $3.00/hr. | A higher listed rate can be cheaper when paid time maps cleanly to completed work. |
| Inference capacity with low baseline traffic | $1.80/hr | A GPU is allocated all month but only does useful serving work 35% of the time. | Utilization-adjusted rate = $1.80 / 0.35 = $5.14 per useful GPU-hour before storage or support. | Steady allocation can make a cheap GPU expensive when traffic is bursty. |
| Batch queue waiting on data staging | $2.50/hr | A 12-hour batch job spends 3 paid hours waiting on dataset staging and checkpoint restore. | Total cost = $30; useful work = 9 GPU-hours; useful GPU-hour cost = $3.33/hr. | Data path problems can turn paid accelerator time into non-useful time. |
| Managed platform with platform premium | $3.40/hr | Managed batching and autoscaling raise utilization from 45% to 80%. | Self-service useful rate at $2.20/hr and 45% utilization = $4.89/hr; managed useful rate at $3.40/hr and 80% utilization = $4.25/hr. | A platform premium can pay back if it materially increases useful utilization. |
RunPlacement quiz
Pressure-test this workload
Compare total GPU-related job cost against completed useful GPU-hours, not listed GPU rate alone.
Uses workload type, budget, GPU need, data movement, priority, and ops tolerance.Quality guide
How to adapt these examples
RunPlacement pages use public provider documentation, source-linked pricing pages where relevant, estimate-labeled examples, and practical decision frameworks. Estimates are directional and should be verified against provider pricing pages before buying or migrating.
Who this is for
- Teams that need concrete examples before comparing GPU vendors.
- AI infrastructure buyers trying to explain why the cheapest hourly rate can lose.
- Engineers turning job logs into a quote comparison.
How to use it
- Replace the hypothetical numbers with real bill lines, job duration, retries, and completed run counts.
- Calculate total GPU-related cost before dividing by completed useful work.
- Use the lessons column to decide what to ask providers next.
Common mistakes
- Using advertised hourly rate as the only cost input.
- Leaving failed or cancelled runs out of the denominator.
- Comparing managed and self-service GPU offers without accounting for team time.
When it does not apply
- Do not treat the hypothetical rows as provider benchmarks.
- Do not use this page to pick a provider without checking availability and contract terms.
- Do not compare model quality or latency from these examples alone.
Worked examples and scenarios
Adapt from job logs
Start with successful run time, failed run time, queue delay, and data staging duration. The goal is not perfect accounting; it is to expose which quote assumptions change the outcome.
Adapt from invoices
Group GPU, storage, transfer, support, and reserved-capacity costs before dividing by completed useful GPU-hours. Hidden line items often change the winner.
Adapt for inference
For inference, completed useful work may be served requests at the target latency rather than training hours. Idle capacity and cold starts still belong in the comparison.
Apply the examples
Use these pages next
The examples are most useful when paired with a real GPU quote, bill line, or workload trace.
An H100 quote is worth comparing only after the provider exposes the GPU shape, minimum rental window, storage, data transfer, capacity model, retry risk, and support terms.
GPU pricingGPU Cloud Idle Cost: How to Price Wasted Accelerator TimeCost estimationGPU cloud idle cost is the gap between paid accelerator time and useful workload progress. It matters most for training retries, batch queues, and inference fleets with low baseline utilization.
GPU pricingRunPod vs Lambda GPU Cloud: How to Compare the FitProvider comparisonRunPod vs Lambda is less about one universal winner and more about workload fit. Compare GPU availability, storage behavior, operational model, support needs, and total job cost for your actual workload.
GPU pricingGPU Cloud Quote ChecklistChecklist / 7 sections / source-linkedA practical checklist and visual worksheet for comparing GPU cloud quotes beyond the advertised hourly rate.
AI inference cost
When the GPU question is really serving cost
Use these pages when the same GPU quote, idle-cost, or useful GPU-hour question is about production inference rather than one-off training.
FAQ
Are these examples real provider benchmarks?
No. They are hypothetical examples designed to show the math. Verify real provider pricing and workload behavior before making a buying decision.
Why can a cheaper GPU hourly rate be more expensive?
A cheaper listed rate can be more expensive when failed jobs, idle time, queueing, low utilization, or data staging reduce completed useful GPU-hours.
What should I compare instead of listed GPU rate?
Compare total GPU-related job cost divided by completed useful GPU-hours.
Sources
RunPlacement quiz
Pressure-test this workload
Compare total GPU-related job cost against completed useful GPU-hours, not listed GPU rate alone.
Uses workload type, budget, GPU need, data movement, priority, and ops tolerance.