AI inference cost
AI Inference Cost Checklist
Short answer: Use this before deciding whether API, managed inference, self-hosted GPU, or batch processing is the right cost model.
- This is a decision checklist, not a final price quote.
- Verify final numbers against provider pricing pages and your own bill or quote.
Next action
Copy the fields
Collect traffic shape, work per request, latency, retries, warm capacity, utilization, shared infrastructure, and operations owner before comparing providers.
Run a scenarioStart here
Use This In 10 Minutes
You do not need perfect numbers to make the first pass useful. Start with rough workload facts, then replace placeholders with logs, bills, and quotes as they become available.
Copy the spreadsheet rows
Paste the tab-separated block into a sheet and keep the hypothetical examples only as placeholders.
Fill the fields you know
Start with request volume, output size, retry rate, serving mode, latency, warm hours, utilization, and ops owner.
Run a scenario
Use the prompt for a planning read or open a matching calculator scenario to compare directional monthly cost.
Filled example
Worked Example: Production Realtime App
Hypothetical example for a user-facing AI feature, not a provider quote or benchmark.
| Input | Hypothetical value |
|---|---|
| Monthly successful requests | 1,000,000 |
| Peak-to-average traffic | 5x |
| Average input / output | 800 input tokens / 250 output tokens |
| Retry or failure allowance | 3% |
| Serving mode under review | API now; managed or self-hosted under consideration |
| Latency requirement | Realtime chat response |
| Warm capacity assumption | 730 warm hours if capacity must stay ready |
| Useful utilization placeholder | 35% |
| Ops owner | Platform engineer owns deploys, monitoring, rollback, and incidents |
What it flags: This example flags the variables that usually move the decision: output size, retries, warm capacity, idle time, utilization, and who owns operations.
Open A Matching Calculator Scenario
Use this when
- An AI app is moving from prototype to production.
- Inference cost threatens product margin.
- The team is considering self-hosting, managed inference, caching, routing, or batch processing.
Not for
- Exact provider pricing without checking current pricing pages.
- Model quality benchmarking.
- Legal, privacy, or procurement approval.
Worksheet Fields
Use this as the working version before copying the decision into a doc, ticket, or vendor email.
| Field | Capture | Why it matters |
|---|---|---|
| Traffic shape | Requests per day, peak-to-average ratio, seasonality, burst pattern. | Determines whether idle capacity dominates. |
| Work per request | Input size, output size, tool calls, retries, context, model size. | Turns product usage into cost drivers. |
| Serving mode | API, managed inference, self-hosted GPU, batch, realtime, hybrid. | Changes what must be paid and operated. |
| Warm capacity | Managed serving hours, self-hosted GPU warm hours, minimum instances, and idle baseline. | Makes always-on cost visible before comparing unit prices. |
| Utilization | Useful inference work as a share of paid capacity. | Shows when a low hourly GPU rate becomes expensive per useful output. |
| Operating burden | Deployment, monitoring, autoscaling, incidents, upgrades, rollback. | Prevents self-hosting math from ignoring team time. |
Spreadsheet-ready
Copy Into A Spreadsheet
Paste this tab-separated worksheet into Google Sheets, Excel, or a planning doc. The examples are hypothetical placeholders; replace them with current pricing, logs, bills, and provider quotes.
Field	What to enter	Hypothetical example	Why it matters
Monthly successful requests	Successful inference requests per month	1,000,000	The denominator for cost per successful request.
Peak-to-average traffic	Peak request rate compared with average traffic	5x peak-to-average	Shows whether warm capacity or burst handling dominates.
Average input size	Input tokens, input data size, or prompt/context size	800 input tokens	Drives API usage or model-serving work.
Average output size	Output tokens, generated payload size, or output duration	250 output tokens	Output can dominate serving cost.
Retry or failure rate	Retries, timeouts, failed calls, and wasted billable work	3%	Separates successful requests from paid attempts.
Serving mode	API, managed inference, self-hosted GPU, batch, realtime, or hybrid	API now; batch possible	Changes what must be paid and operated.
Latency requirement	Realtime, near-realtime, queued, overnight, or flexible	Realtime for chat; batch for enrichment	Determines whether warm capacity is required.
Warm hours per month	Always-on managed instances or self-hosted GPU hours	730 warm hours	Makes idle baseline visible.
Useful utilization	Useful inference work divided by paid serving capacity	35%	Shows whether paid GPU hours are doing useful work.
Shared infrastructure	Storage, network transfer, observability, support, platform fees	$500/month placeholder	Prevents unit-price comparisons from missing overhead.
Ops owner	Who owns deploys, monitoring, upgrades, rollback, and incidents	Platform engineer	Prevents self-hosting math from assuming free operations.
Notes	Missing assumptions, current source links, quote IDs, or caveats	Replace all placeholders before buying	Keeps the estimate honest.
AI prompt
Prompt To Analyze Your Inference Cost
Paste the spreadsheet rows or worksheet answers into your AI tool with this prompt. Treat the output as a planning read, not procurement, benchmarking, legal, compliance, or pricing approval.
You are helping me estimate AI inference cost. Do not assume current provider pricing unless I provide it. Use directional estimates only and clearly label missing assumptions.

Here are my workload details:
[Paste the worksheet rows here]

Please:
1. Compare API inference, managed inference, self-hosted GPU, batch inference, and hybrid routing as possible serving modes.
2. Estimate the cost categories that belong in total monthly serving cost for each option.
3. Normalize each option to effective cost per successful request where enough inputs exist.
4. Identify the sensitive variables: request volume, output size, retry/failure rate, utilization, warm hours, shared infrastructure, and operations overhead.
5. Flag any missing assumptions that could change the decision.
6. Recommend what data I should collect next before buying capacity, migrating, or self-hosting.
7. Keep the recommendation provider-neutral and avoid current pricing, benchmark, or provider-ranking claims unless I supplied the source data.
Short Answer
- Estimate AI inference cost by request, by month, and by serving mode.
- API, managed inference, and self-hosted GPU only become comparable after idle capacity and operations are included.
- Use hypothetical estimates first, then replace them with real logs, bills, and provider quotes.
Comparison Table
- API inference: simplest for prototypes and uncertain usage.
- Managed inference: useful when autoscaling, batching, and support reduce operational load.
- Self-hosted GPU: strongest when utilization is high and control matters.
- Batch inference: strongest when latency is flexible and utilization matters.
- Hybrid routing: strongest when caching, small models, and batch queues can reduce expensive calls.
Reusable Formulas
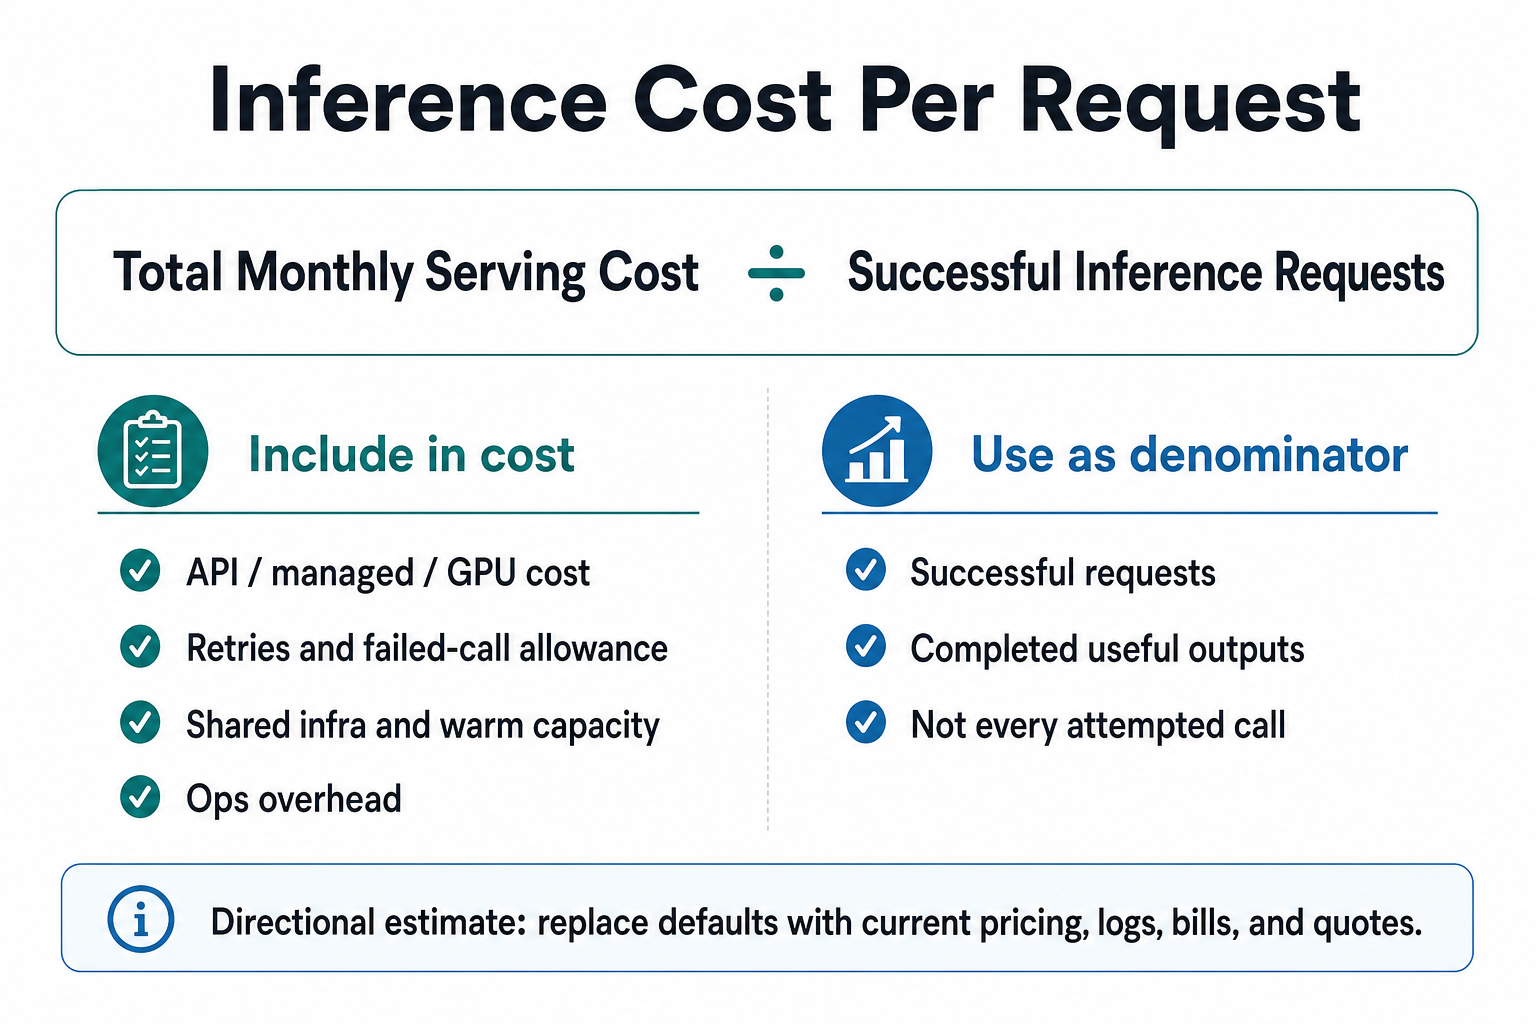
- inference cost per request = input cost + output cost + infrastructure overhead.
- self-hosted inference cost = GPU hours + storage + networking + idle capacity + engineering overhead.
- effective inference cost = total monthly serving cost / successful inference requests.
Scenario Shortcuts
- Prototype API: open the calculator with lower volume and uncertain usage when the product still needs usage evidence.
- Production realtime: open the calculator with always-warm capacity when latency and peak traffic matter.
- Batch workload: open the calculator with higher utilization when queueing is acceptable.
Companion Assets
- Use the AI inference cost calculator to turn the worksheet fields into directional monthly cost and cost per successful request.
- Use the inference cost per request formula infographic when you need a simple visual explanation.
- Use the AI inference cost model for definitions, formulas, and examples.
- Use the API vs self-hosted inference decision tree when the worksheet raises a serving-mode choice.
Questions To Ask Before Changing Serving Mode
- Which requests truly need realtime output?
- What is the acceptable delay for non-critical work?
- How many requests fail, retry, or time out?
- Who owns deployment, monitoring, and rollback?
- What data must move into or out of the inference environment?
Red Flags
- The model uses average traffic but ignores peaks.
- Self-hosting excludes engineer time and on-call.
- API math ignores retries, long outputs, and tool calls.
- Managed inference quote hides minimum capacity or platform fees.
When This Worksheet Helps
- Use it when an AI app has enough usage to make inference cost visible, but not enough clarity to choose API, managed inference, self-hosted GPU, batch, or hybrid serving confidently.
- It works best before a team asks for quotes, buys capacity, or rewrites serving infrastructure.
- Caveat: this is a directional worksheet, not current provider pricing, a benchmark, a procurement recommendation, or legal/compliance advice.
Helpful companion pages
Turn the checklist into a cost read
This page is the practical companion to the calculator and formula visual. It gives writers, builders, and MLOps teams the fields to collect before comparing API inference, managed serving, or self-hosted GPUs.
FAQ
What should an AI inference cost checklist include?
An AI inference cost checklist should include traffic shape, input and output size, retries, failed calls, latency needs, idle capacity, storage, networking, observability, reliability work, and engineering overhead. It should also separate realtime, batch, cacheable, and hybrid requests before comparing serving modes.
How do I compare API and GPU inference?
Compare API and GPU inference by normalizing each option to total monthly cost per successful request. API math should include input, output, retries, and workflow multipliers. GPU math should include warm hours, utilization, storage, networking, observability, support, and engineering time.
What is a common inference cost trap?
A common inference cost trap is optimizing token price or GPU hourly rate before measuring request shape. Long outputs, retries, tool calls, cache misses, always-warm capacity, low utilization, and engineering time can matter more than the visible unit price. Use current provider pages for exact rates.
Sources
- https://platform.openai.com/docs/pricing
- https://docs.aws.amazon.com/sagemaker/latest/dg/deploy-model.html
- https://docs.aws.amazon.com/sagemaker/latest/dg/batch-transform.html
- https://cloud.google.com/vertex-ai/docs/predictions/overview
- https://docs.nvidia.com/datacenter/dcgm/latest/user-guide/feature-overview.html
AI inference cost quiz
Get an AI compute cost read
Capture traffic shape, token/workload size, latency, utilization, idle capacity, storage, network, and engineering overhead before comparing serving options.
Uses actual request volume, latency, GPU need, data movement, priority, and ops tolerance.